Physician's
Master Diet |
| Date: | 5/6/07 | Physician: | Dr. Juan Garcia | |
| Name: | Mary Jo Johnson | Physical Problems: | Hypertension | |
| Day | Weight | Wt Chg+/- |
Total Calories |
Fat(g) | Carbs(g) | Prot(g) | Chol(g) | Na(mg) | K(mg) | Ca(mg) | Column A | Column B | Column C | Calories Burned |
|---|---|---|---|---|---|---|---|---|---|---|---|---|---|---|
| 4/23/07 | ---- | ---- | ---- | ---- | ---- | ---- | ---- | ---- | ---- | ---- | ---- | ---- | ---- | ---- |
| 4/24/07 | ---- | ---- | ---- | ---- | ---- | ---- | ---- | ---- | ---- | ---- | ---- | ---- | ---- | ---- |
| 4/25/07 | ---- | ---- | ---- | ---- | ---- | ---- | ---- | ---- | ---- | ---- | ---- | ---- | ---- | ---- |
| 4/26/07 | ---- | ---- | 2378 | 63 | 417 | 54 | 111 | 2158 | 2750 | 384 | ---- | ---- | ---- | ---- |
| 4/27/07 | 191 | ---- | 1926 | 48 | 262 | 111 | 284 | 1523 | 2933 | 469 | ---- | ---- | ---- | 72 |
| 4/28/07 | 190 | -1 | 1988 | 60 | 291 | 65 | 295 | 2156 | 2979 | 230 | ---- | ---- | ---- | 72 |
| 4/29/07 | 189 | -1 | 1558 | 54 | 193 | 93 | 182 | 1186 | 4176 | 310 | ---- | ---- | ---- | 72 |
| 4/30/07 | ---- | ---- | 1476 | 48 | 126 | 129 | 262 | 1421 | 2667 | 722 | ---- | ---- | ---- | ---- |
| 5/1/07 | ---- | ---- | 706 | 26 | 112 | 13 | 22 | 353 | 1035 | 262 | ---- | ---- | ---- | ---- |
| 5/2/07 | ---- | ---- | 702 | 19 | 111 | 37 | 100 | 97 | 1850 | 209 | ---- | ---- | ---- | ---- |
| 5/3/07 | ---- | ---- | 1090 | 41 | 165 | 25 | 109 | 1151 | 779 | 353 | ---- | ---- | ---- | ---- |
| 5/4/07 | 187 | -2 | 689 | 20 | 109 | 23 | 430 | 739 | 1415 | 178 | ---- | ---- | ---- | 72 |
| 5/5/07 | ---- | ---- | 700 | 19 | 130 | 13 | 215 | 931 | 1333 | 134 | ---- | ---- | ---- | ---- |
| 5/6/07 | 188 | 1 | 2129 | 48 | 324 | 49 | 94 | 1310 | 2237 | 216 | ---- | ---- | ---- | ---- |
| Averages: | -0.75 | 1,394.73 | 40.55 | 203.64 | 55.64 | 191.27 | 1,184.09 | 2,195.82 | 315.18 | ---- | ---- | ---- | 72.00 | |
| 26% | 58% | 16% | ||||||||||||
| Ideal for you: | +-0.28 | 2472 | 55 | 309 | 185 | 300 | 500 | 2000 | 900 | ---- | ---- | ---- | 635.71 | |
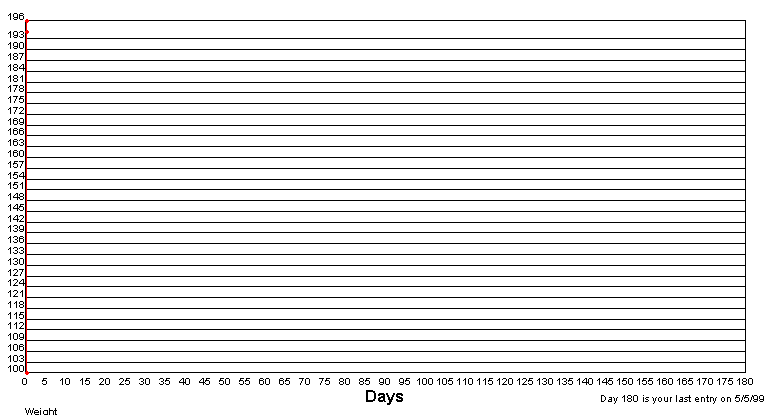
This chart keeps track or your weight changes for the previous 180 days. It utilizes a
simple line chart design to allow you to visually see your progress.
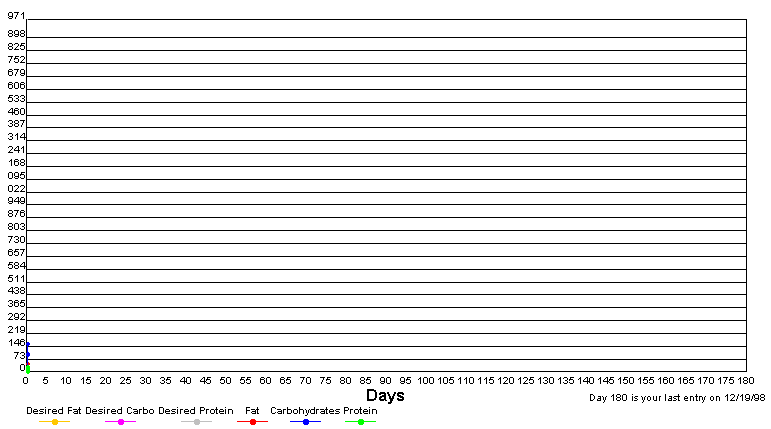
This chart displays your intake of fats, carbos, and proteins. The horizontal colored lines represent your target amount for each. The farther the chart lines are above or below your target line represent how far off you are of the target amount. Ideally, all your lines should fall exactly on top of the target lines.